Recently, GridIron and Brocade announced a new joint Reference Architecture for large scale cloud-enabled clustered applications that delivers record performance and energy savings. While the specific configuration that was validated by Demartek was for Clustered MySQL Applications, the architecture and the benefits apply equally to other cluster configurations such as Oracle RAC and Hadoop. The announcement is available here: GridIron Systems and Brocade Set New 1 Million IOPS Standard for Cloud-based Application Performance and Demartek’s evaluation report is available online at: GridIron & Brocade 1 Million IOPS Performance Evalution Report.
Let us take a closer look at the Total Cost of Ownership (TCO) profile of the Reference Architecture vis-à-vis alternatives. For the OpEx component, we’ll just use power consumption as the main/only metric.
Requirements:
- Total IOPS needed from the cluster = 1 Million Read IOPS and 500,000 Write IOPS
- Total capacity of the aggregate database = 50 TB
Assumptions:
- Cost of a server with the requisite amount of memory, network adapters, 4x HDDs RAIDed, etc. = $3,000
- Number of Read/Write IOPS out of a server with internal/local disks = 500
- Power consumption per average server = 500 Watts
- It takes a watt to cool a watt; in other words if a server consumes 500 Watts, it takes another 500 Watts to cool that server
- Cost of Power: USA commercial pricing average of $0.107/KWH
- The cost of the many Ethernet switch ports vs. the few Fibre Channel switch ports is assumed to be equivalent and will be excluded from the calculations.
Option 1: Traditional Implementation Using Physical Servers
In this scenario, IOPS is more of a determining factor for the number of servers required rather than the capacity of the total database.
- Number of servers (with spinning HDDs) required to hit 1 Million IOPS = 1,000
- Assuming 40 servers per rack, total number of Racks = 1,000/40 = 25 Racks
- Cost of the server infrastructure = 1,000 * 3,000 = $3,000,000
- Power consumed by the serves = 500 * 1,000 = 500 kW
- Power required for cooling = 500 kW
- Total power consumption = 1000 kW
- Annual OpEx based on power consumption = $0.107 * 1000 * 24 * 365 = $937,320
- Capacity of each PCIe flash card = 300 GB
- Two PCIe cards will be used to RAID/mirror per server
- Number of servers required to get to 50TB total = 167
- Assuming 40 servers per rack, total number of racks required = 5 Racks
- Cost of the server infrastructure = 167 * 3,000 = $501,000
- Cost of the PCIe flash cards ($17/GB) = 2 * 167 * 300 * 17 = $1,703,400
- Total cost of server infrastructure including flash = $2,204,400
- Power consumed by the servers = 500 * 167 = 83 kW
- Power required for cooling = 83 kW
- Total power consumption = 166 kW
- Annual OpEx based on power consumption = $0.107 * 166 * 24 * 365 = $155,595
Option 3: Implementation Using GridIron-Brocade Reference Architecture
Two GridIron OneAppliance FlashCubes will be used for a mirrored HA configuration. Each FlashCube has 50TB of Flash.
- Number of servers required = 20
- Rack Units of the two FlashCubes = 2 * 5 = 10 RU
- Total number of Racks = 1 Rack
- Cost of the server infrastructure = 20 * 3,000 = $60,000
- Cost of the FlashCubes = 2 * 300,000 = $600,000
- Total cost of the server infrastructure including flash = $660,000
- Power consumption per FlashCube = 1,100W
- Power consumed by the servers and FlashCube = 20 * 500 + 2 * 1,100 = 12.2 kW
- Power required for cooling = 12.2 kW
- Total power consumption = 24.4 kW
- Annual OpEx based on power consumption = $0.107 * 24.4 * 24 * 365 = $22,871
| Traditional | Traditional with PCIe Flash | GridIron-Brocade Reference Architecture | |
| Number of servers | 1,000 | 167 | 20 |
| Number of Racks | 25 | 5 | 1 |
| CapEx of Infrastructure | $3,000,000 | $2,204,000 | $660,000 |
| Power Consumption (kW) | 1,000 | 166 | 24 |
| OpEx* (just based on power) | $937,320 | $155,595 | $22,871 |
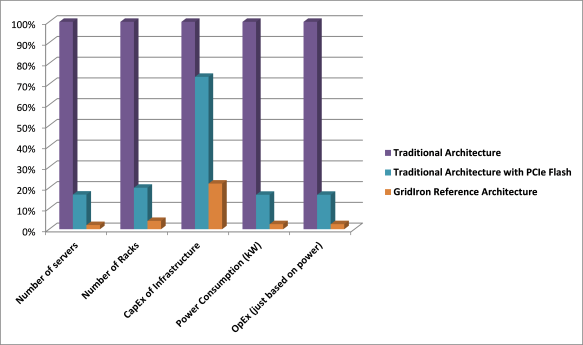
Normalized Comparison of Different Approaches
By normalizing the values in the comparison table (where the values of the traditional approach is at 100% and the other values are relative to 100%), we get the following graph. It is very clear from the graph that both the CapEx and OpEx are dramatically lower with the GridIron-Brocade Reference Architecture.

